The data exists
But the first reading often demands more technical time than it should.
Alpha BlackBox records the evidence of your trading. The Dashboard organizes it so you can read it clearly without replacing the forensic base of the dataset.
It does not replace Alpha BlackBox. It makes it more visible, more navigable and more useful in day-to-day reading.
CSV files contain the evidence, but they do not always offer a fast human reading. When information is split across trades, equity, cash flow, integrity and risk, the first review can become slow, fragmented and unclear.
But the first reading often demands more technical time than it should.
Each file explains a different part of the story, not always in the most useful order.
Without a visual layer, it is harder to see quickly where you should look first.
The Dashboard does not change the truth of the dataset. It orders that truth so the initial reading becomes faster, clearer and more useful.
The Dashboard does not invent another reality. It makes the evidence already recorded by Alpha BlackBox easier to read.
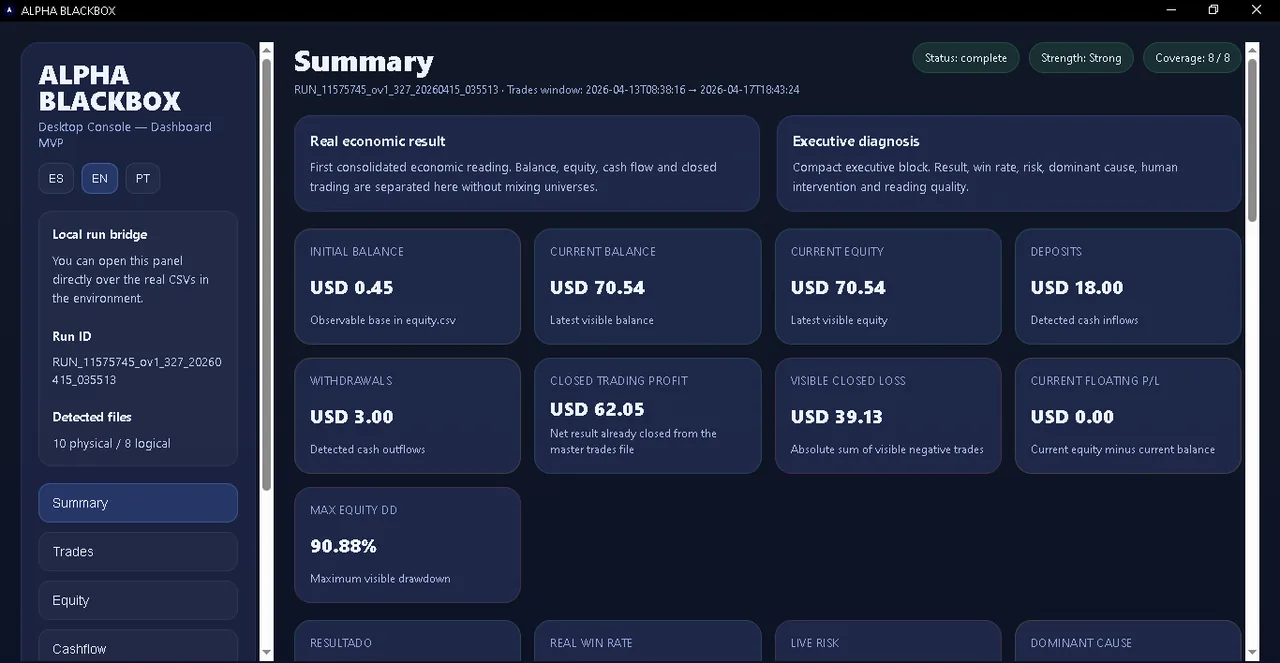
Concentrates balance, equity, visible drawdown, economic result and the first useful reading signals.
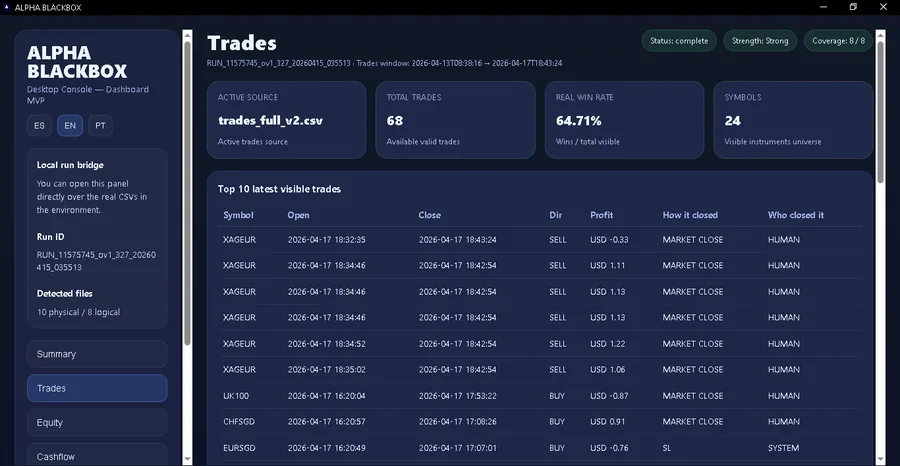
Reduces review time when you need to identify quantity, PnL, win rate and observable sequence.
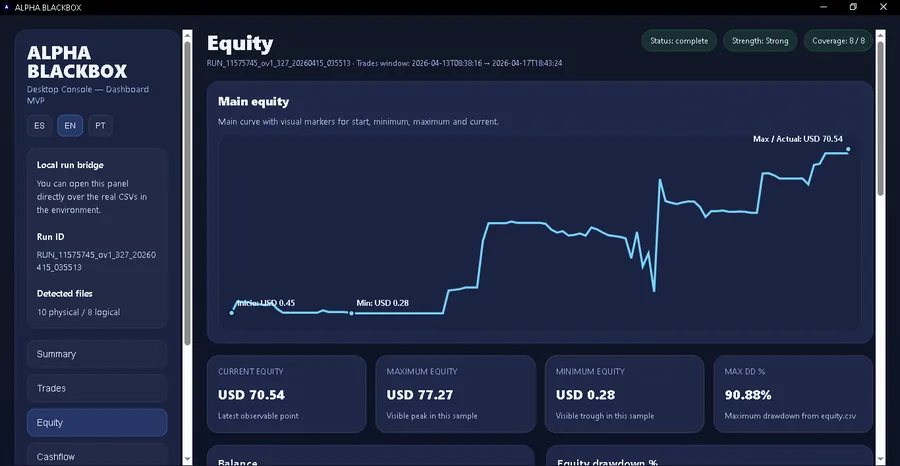
Turns balance and equity evolution into a more immediate visual reading of account behavior.
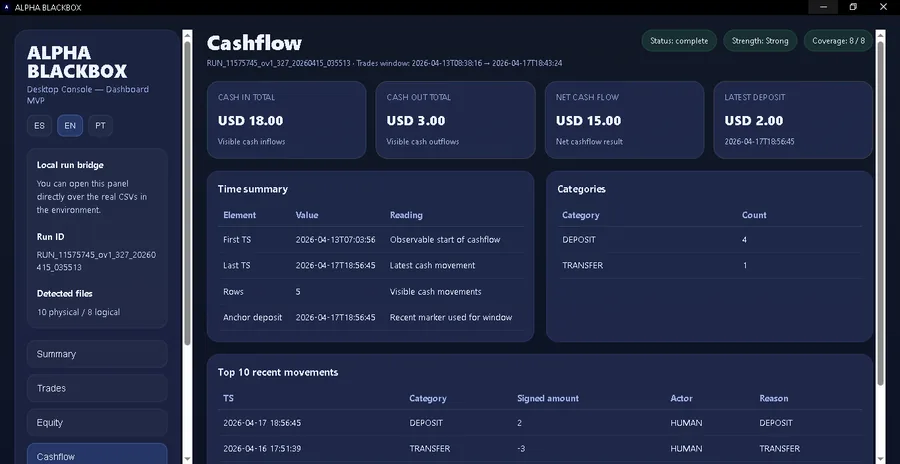
Separates deposits and withdrawals from trading results so interpretation is cleaner.
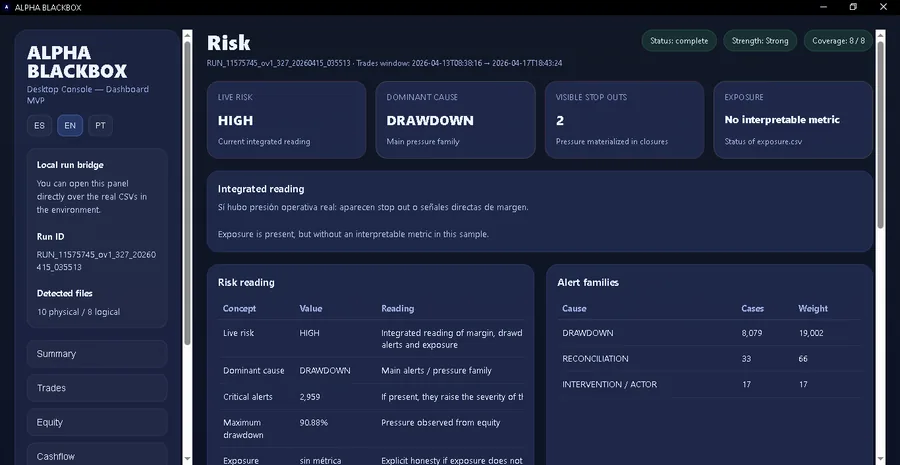
Helps detect pressure, aggressiveness, deterioration and visible damage structure.
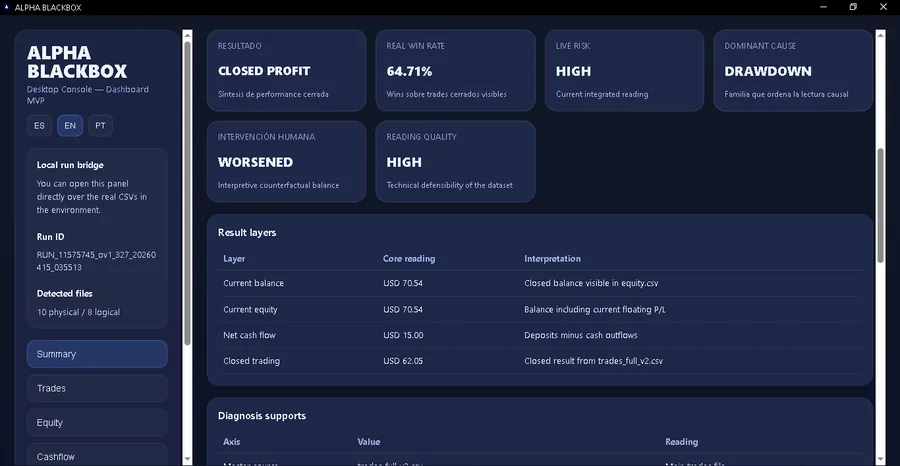
It does not show performance. It shows reading confidence, dataset coverage and minimum conditions for honest interpretation.
Some modules work better as second-pass reading: they add comparison, auditability or structure after you understand the main picture.
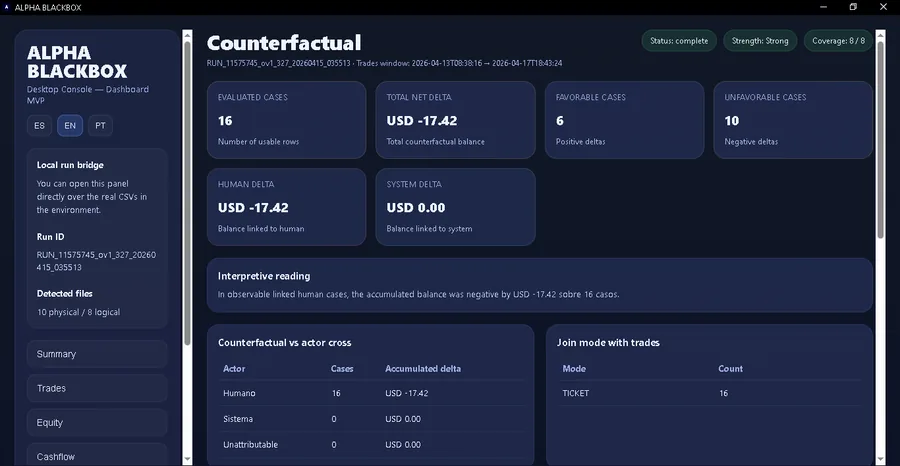
Adds comparison between what happened and the available counterfactual scenario when the dataset supports it.
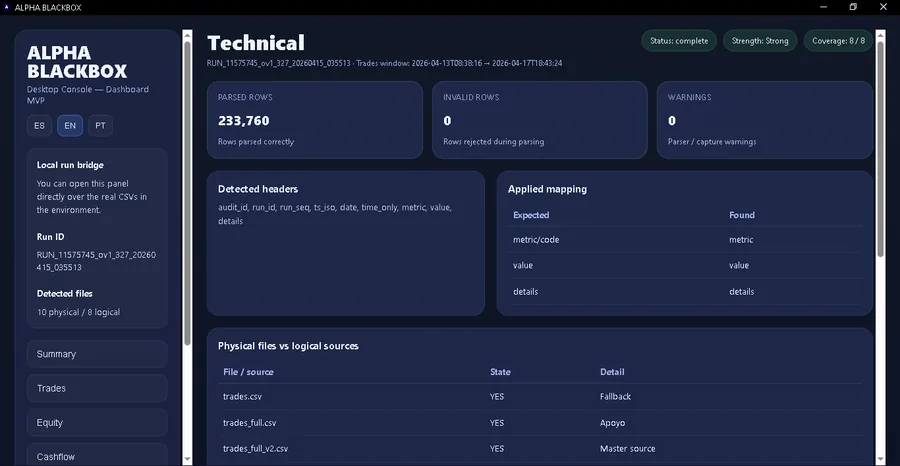
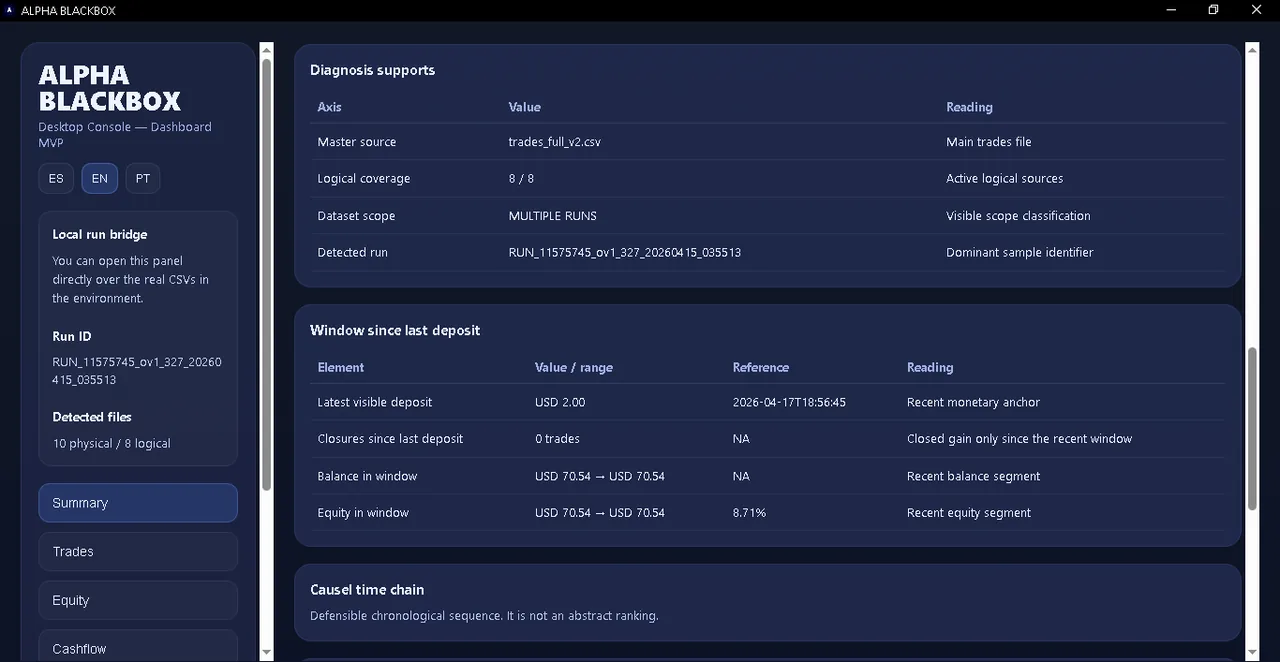
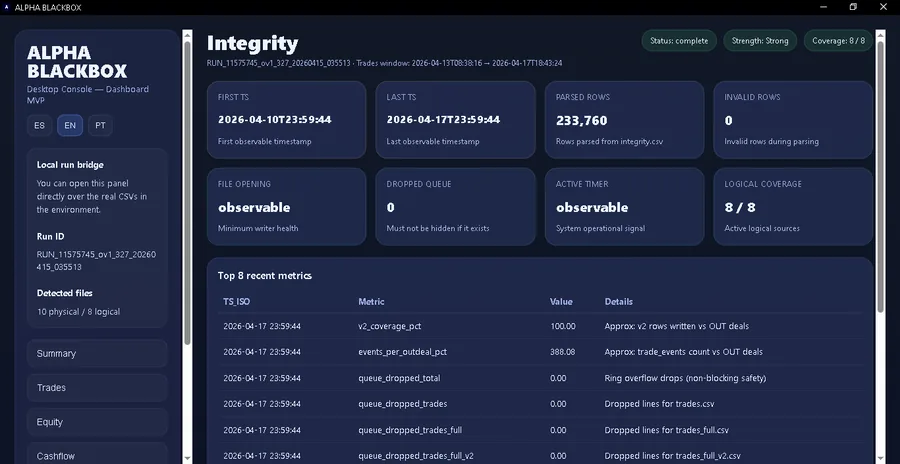
Exposes detected files, reading support and environment structure without dominating the main experience.
The promise is not to show more. The promise is to show better and in the right order.
This is where summary, trades, equity, cash flow and the first risk reading live. It answers quickly what happened, how much damage there was and where deeper review should begin.
This is where integrity, technical detail and comparative layers live. They are not decoration; they support the reading with a verifiable base.
Alpha BlackBox remains the base. The Dashboard is the operational reading interface that orders that evidence before the forensic deep dive.
It records operational truth in structured files.
It summarizes, orders and makes that evidence navigable.
Prompts or later analysis enter when more comparison, causality and judgment are needed.
Alpha BlackBox records. The Dashboard shows. Later analysis deepens.
To review what happened with more clarity without always starting from raw files.
To organize outcome, risk and integrity before moving into finer technical analysis.
To read visible operational state, deterioration, cash movement and data coverage faster.
To avoid rebuilding the basic reading by hand every time you inspect a run.
Its value comes from organizing the available truth better, not from inflating what the system can do.